
|
|
| Home |
|
|
|
Documentation Screenshots Download/Sources Links Roadmap Bugs & Wishes

|
 |

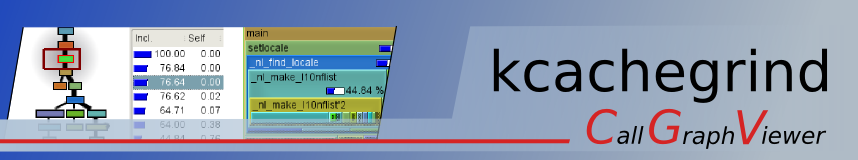
The Call Graph ViewThe call graph view shows a graph built up around the currently selected function, which is the node centered on the grey-blended pyramid in the background. Each node represents a function, and each edge represents calls.Cost shown per function is the cost spent while that function and the selected function are running. I.e. suppose a function C called both from A and B; in the call-graph of A, cost of node C only gives the cost when called from A, not any cost while called from B. Doubleclicking on a node selects this function. This is the best way for fast browsing the call graph of your application. The graph is limited by various configurable options. Default values are:
|