
|
|
| Home |
|
|
|
Documentation Screenshots Download/Sources Links Roadmap Bugs & Wishes

|
 |
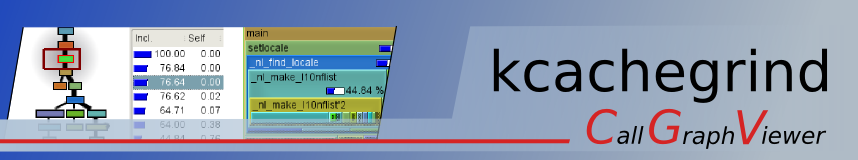
Screenshot 1After starting up KCachegrind and loading a set of trace parts, the function "main" is automatically selected.
As you can see in the "Trace Part Overview" Dock, we have 8 trace parts here. The "Flat Profile" shows the list of functions available, sorted with highest cumulative cost on top. The Info Tab of the main window shows the cost of the selected function: In the first list, separated by cost type; the current cost type is "Cycle Estimation", as shown in the combobox on the toolbar. This is the default cost type and an estimation of the runtime in CPU cycles. The second list shows the costs (of current cost type), spent in the different trace parts. You can see function main starting in part 1, and being active till program termination. Each function gets its own color in the visualization graphs: e.g. function "main", currently selected, has color cyan. The whole program run is, of course, covered this function. Looking at the "Trace Part Overview" again, you see all parts with a cyan frame. Inside are the direct calls of "main" shown, in there own colors. Thus, you see the function coverage over run time easily at one sight. Because no part is selected, the costs shown in the "Flat Profile" are costs summed over all trace parts. Be selecting one part in the "Trace Part Overview", you would see the cost spent in this part only.
|
